You ask:
Skip the BI tools.
Ship the dashboard.
Connect your data. Ask questions. Build dashboards. Share the link. That's it.
Plans start at $99/month — book a demo to see it on your data.
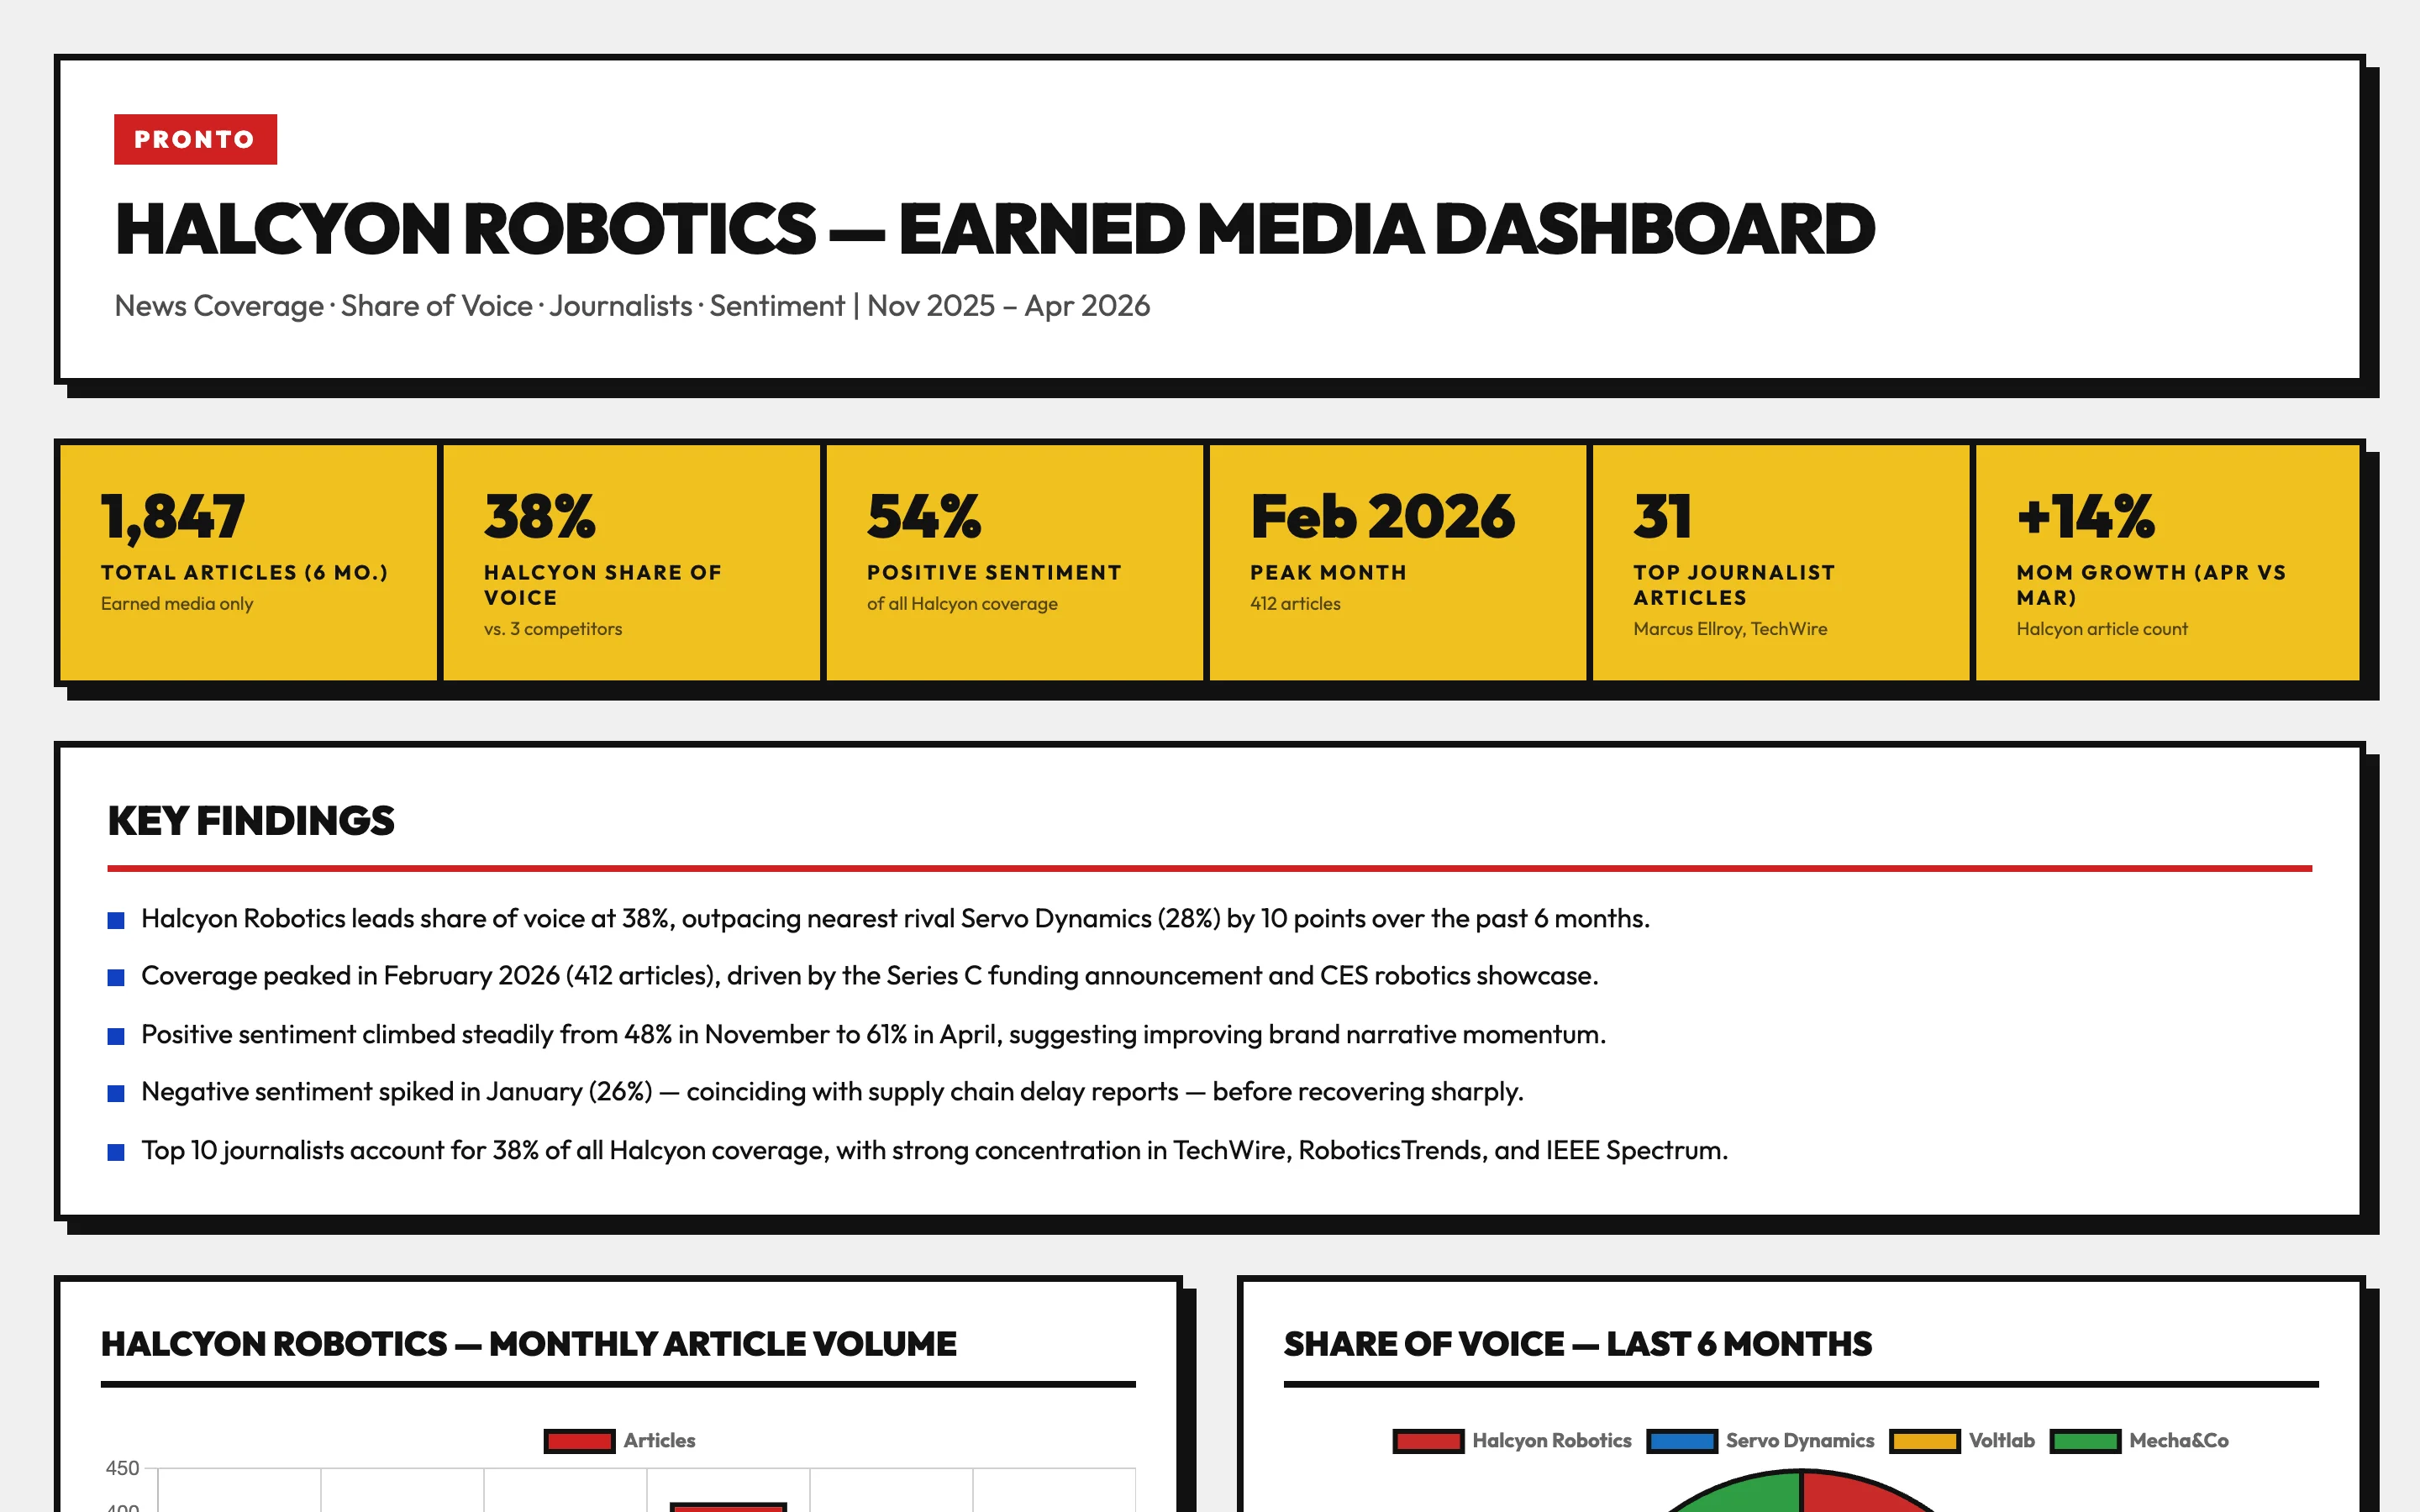
Instant Dashboards is an AI client-reporting platform for PR and marketing agencies. Ask a question in plain English — like 'show me share of voice by outlet for the last 30 days' — and get a live, white-labeled dashboard your client can open anytime. No BI tools, no templates, no analyst required.
How it works
1. Connect your data
Redshift, Athena, Postgres, or MCP servers. Sixty seconds.
2. Ask in plain English
"How are sales trending?" We read your schema and write the SQL.
3. Share the dashboard
Get a link. Embed it. Edit by clicking. Update with another question.
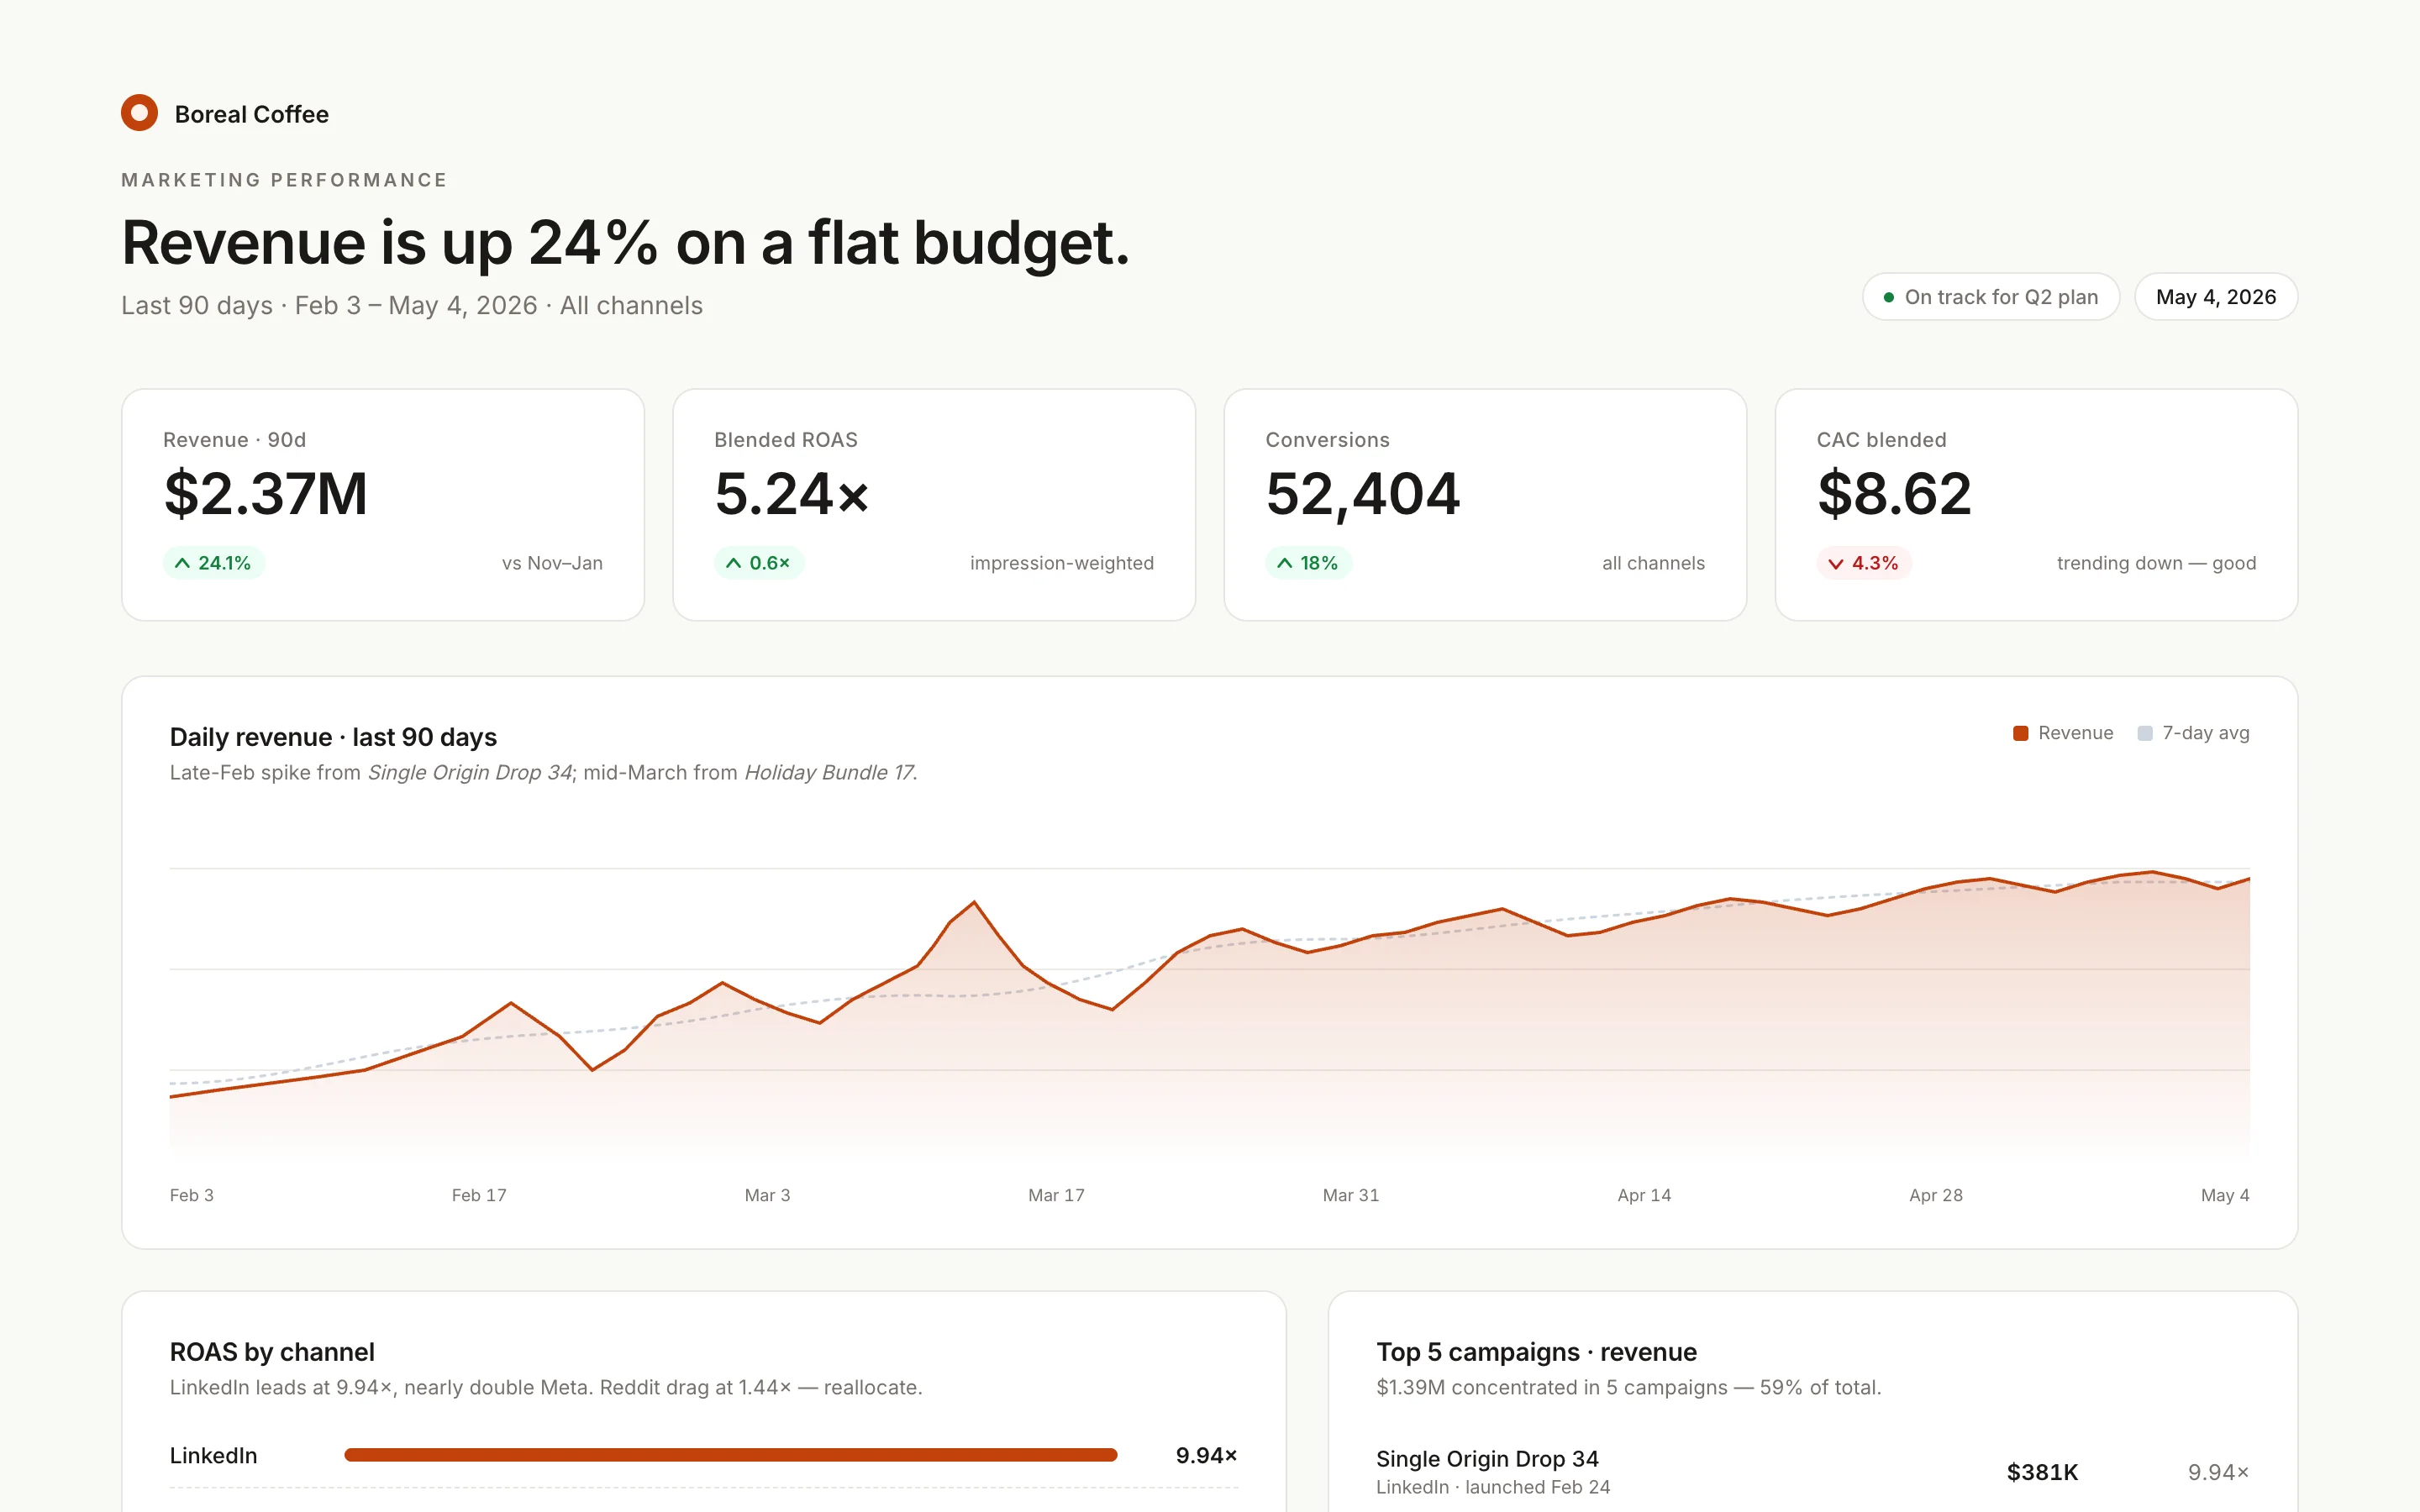
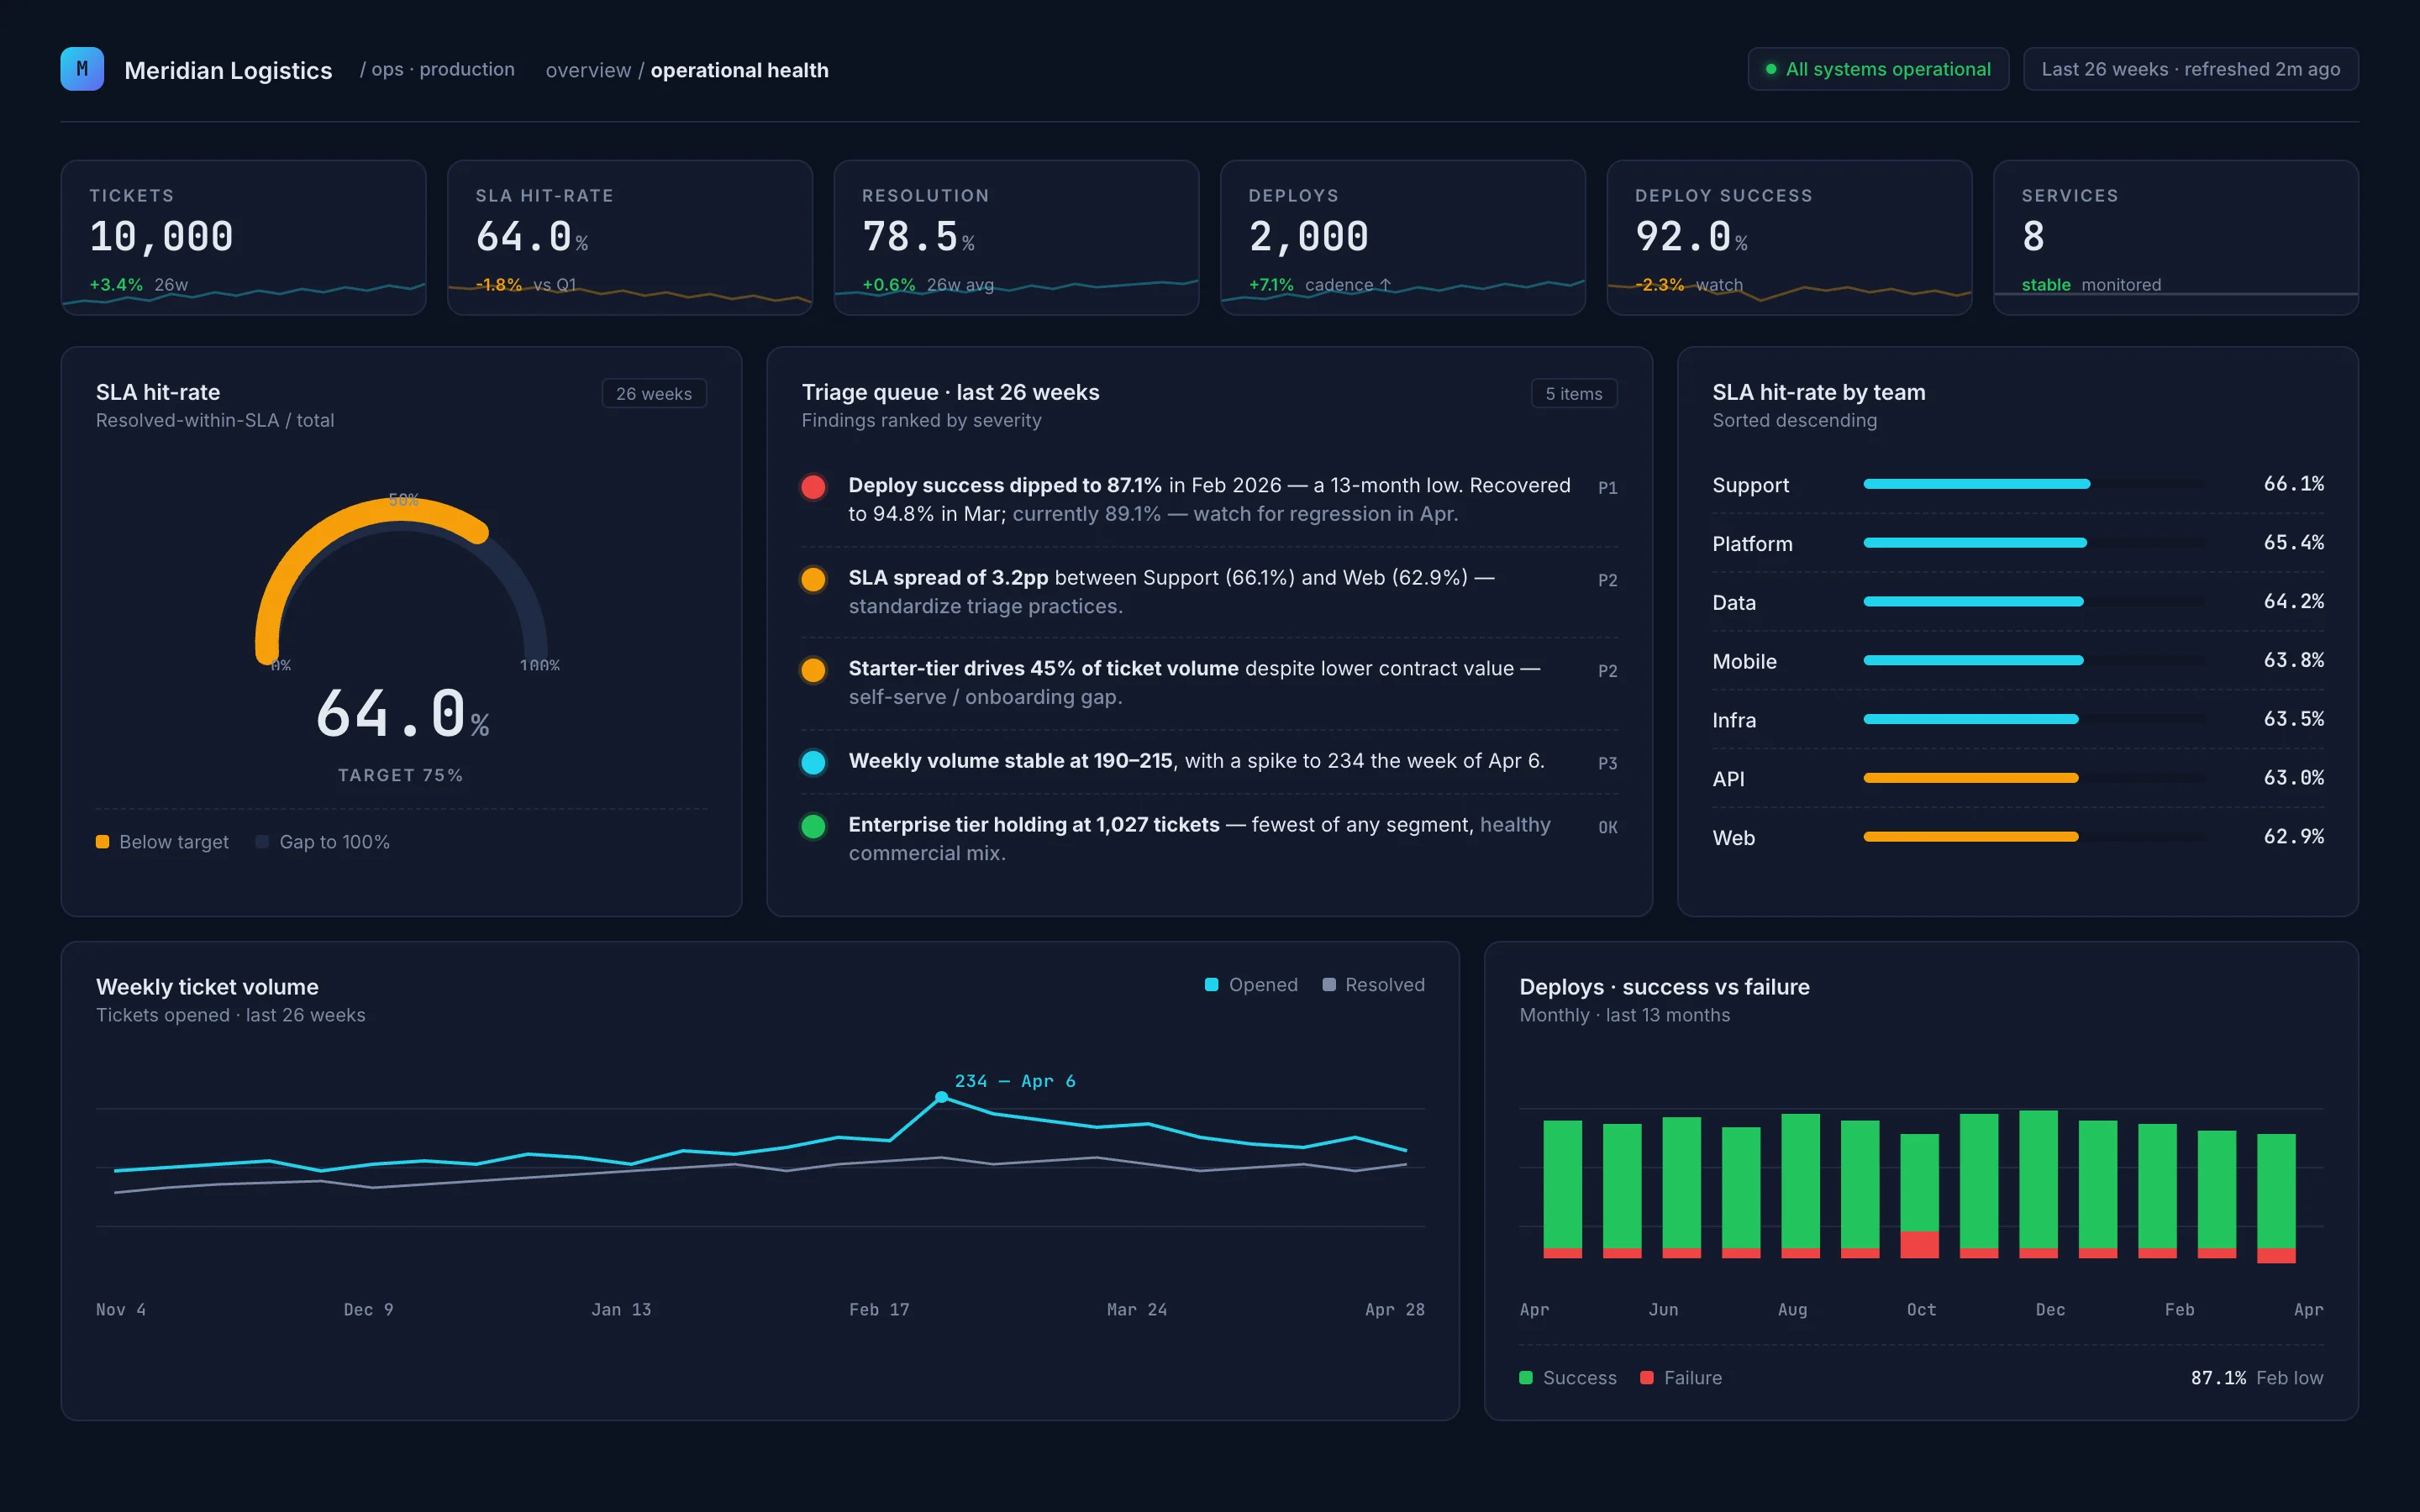
Real dashboards from real prompts
Each one was built in under 5 minutes.
Connect your marketing stack
Campaign, analytics, and business data in one place — read-only, always.
Google Ads
Pull campaign performance — impressions, clicks, cost, and conversions — straight into your dashboards. We read your account with the Google Ads API in read-only mode and never create, edit, pause, or delete a single campaign, ad, or budget.
Google Analytics (GA4)
Sessions, traffic sources, top pages, and conversions from GA4 — refreshed daily and ready to chart.
Warehouses & more
Redshift, Athena, Postgres, Google Sheets, and any MCP server you can authenticate against.
Every connection is read-only and authorized by you through secure Google OAuth. Your credentials are encrypted at rest, and you can revoke access at any time.
What you can do
Ask anything
Natural-language questions. Claude picks the tables, writes the SQL, validates the results.
Themes
Apply multiple themes to any dashboard instantly with one click.
Edit by clicking
Point at any headline, chart, or copy block. Type the change. Done.
Connect anywhere
Redshift, Athena, Postgres, and any MCP server you can authenticate against.
Live or static
Re-query on every load, or freeze the snapshot. Toggle per dashboard.
Get in touch
Questions, a demo for your team, or just want to say hi — khasim@inlyt.io